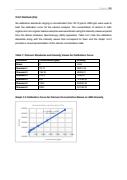
                                P a g e | 25
3.3.2 Calcium (Ca)
Six calibration standards ranging in concentration from 78.13 ppb to 2500 ppb were used to
build the calibration curve for the calcium analysis. The concentration of calcium in both
organic and non-organic banana samples was ascertained using the intensity values acquired
from the Atomic Emission Spectroscopy (AES) apparatus. Table 3.4.1 lists the calibration
standards along with the intensity values that correspond to them and the Graph 3.4.2
provides a visual representation of the calcium concentration data.
Table 7: Calcium Standards and Intensity Values for Calibration Curve
StandardsConcentration (ppb)Intensity
Blank0-0.06
Standard 178.1334931.48
Standard 2156.2548206.21
Standard 3312.573283.4
Standard 4625131248.52
Standard 51250245550.58
Standard 62500472149.23
Graph 3.2 Calibration Curve for Calcium Concentration Based on AES Intensity
Concentration v/s Intensity of Ca
500000
y = 183.88x + 14334
R² = 0.9983400000
Intensity300000
200000
100000
0
0500100015002000
-100000
concentration (ppb)25003000