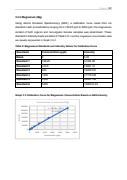
                                P a g e | 27
3.3.3 Magnesium (Mg)
Using Atomic Emission Spectroscopy (AES), a calibration curve made from six
standards with concentrations ranging from 156.25 ppb to 5000 ppb, the magnesium
content of both organic and non-organic banana samples was determined. These
standards' intensity levels are listed in Table 3.5.1 and the magnesium concentration data
are visually represented in Graph 3.5.2.
Table 9: Magnesium Standards and Intensity Values for Calibration Curve
StandardsConcentration (ppb)Intensity
Blank00.02
Standard 1156.2531326.08
Standard 2312.573097.12
Standard 3625162222.67
Standard 41250311755.06
Standard 52500593201.89
Standard 650001086391.99
Graph 3.3 Calibration Curve for Magnesium Concentration Based on AES Intensity
Concentration v/s Intensity of Mg
1200000
y = 218.58x + 15192
R² = 0.997
Intensity1000000
800000
600000
400000
200000
0
01000200030004000
Concentration (ppb)50006000